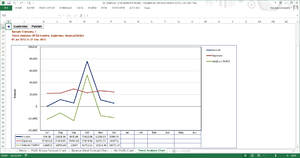
Trend Analysis Chart
Jump to navigation
Jump to search
Overview
The Trend Analysis Chart displays the months across the page and charts Income, Expenses and Net Profit for the Version selected.
How to view this chart
To view this chart, follow these steps.
- From the Menu, click on 16. Charts;
- Click on Trend Analysis Chart.
How to use this chart
You can control the number of months included on the chart by changing the selected period.
