Difference between revisions of "Monthly Cash Flow Statement"
Jump to navigation
Jump to search
(Created page with "== Overview == 300px|thumb|right|Monthly Cash Flow Statement The Monthly Cash Flow Statement report displays up to 12 months of data a...") |
|||
| Line 5: | Line 5: | ||
The Monthly Cash Flow Statement report displays up to 12 months of data across the page and [[Accounts|profit and loss accounts]] down the page. | The Monthly Cash Flow Statement report displays up to 12 months of data across the page and [[Accounts|profit and loss accounts]] down the page. | ||
Rather than display your original chart of accounts, it instead | Rather than display your original chart of accounts, it instead displays a [[Account Hierarchies|cash flow hierarchy]]. | ||
== How to view this report == | == How to view this report == | ||
Latest revision as of 23:11, 21 May 2017
Overview
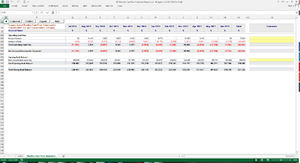
The Monthly Cash Flow Statement report displays up to 12 months of data across the page and profit and loss accounts down the page.
Rather than display your original chart of accounts, it instead displays a cash flow hierarchy.
How to view this report
To view this report, follow these steps.
- From the Menu, click on 29. Monthly Cash Flow Statement Report;
- Click on Monthly Cash Flow Statement.
How to use this report
You can control the number of columns displayed on this report by changing the selected period.
